1. Summary
Travelling ionospheric disturbances (TIDs) constitute a threat for operational systems using ground-based HF and trans-ionospheric VHF-UHF radiowave propagation. TIDs can impose disturbances with amplitudes of up to ~20% of the ambient electron density, and a Doppler frequency shifts of the order of 0.5 Hz on HF signals. Therefore, their identification and tracking is important for the reliable operation of critical systems using the ionosphere as an essential part or for systems for which the ionosphere is fundamentally a nuisance.
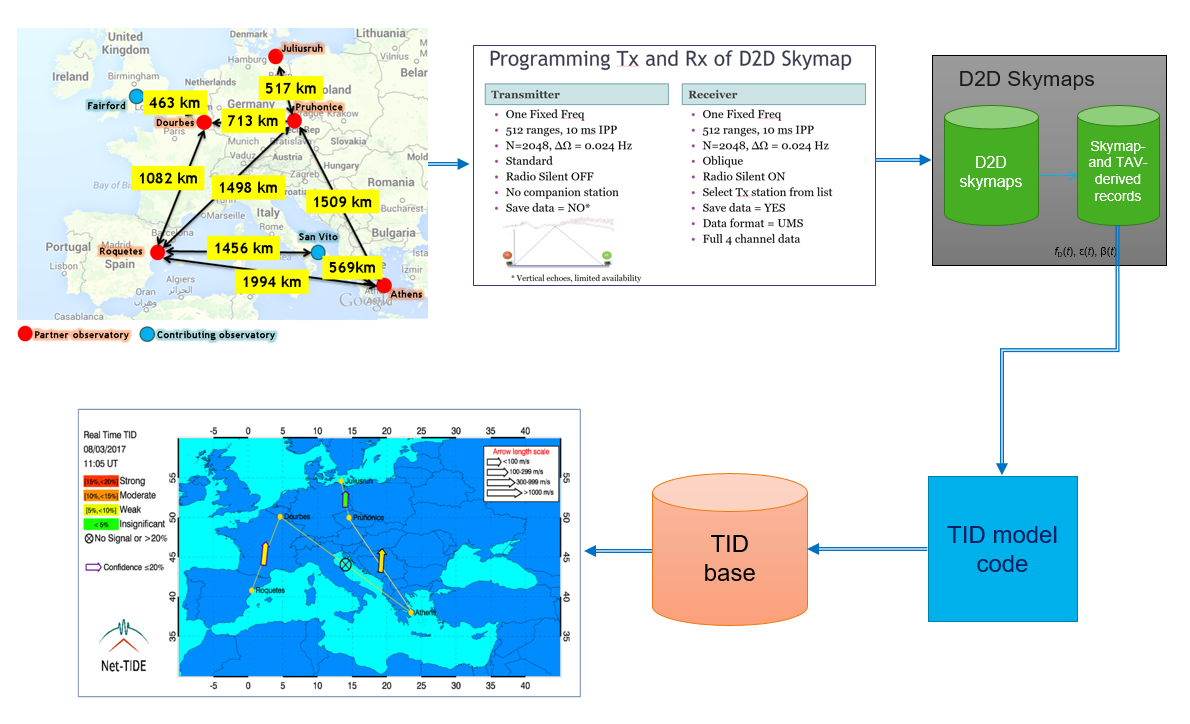
The Net-TIDE project has developed a warning system for real-time identification of TIDs using skywave Doppler frequency and angle-of-arrival measurements archived in a Digisonde-to-Digisonde (D2D) format. Data are collected from network-coordinated HF sounding between pairs of European DPS4D and processed in real-time for the calculation of the angles-of-arrival and Doppler frequencies of ionospherically reflected high-frequency (HF) radio signals. In the Net-TIDE methodology, the ionosphere is represented by a moving undulated mirror, to relate HF signal parameters to TID characteristics, using the Doppler-Frequency-Angular-Sounding (FAS) technique.
The raw data (D2D skymaps and ionograms) are deposited in near real time via Internet in corresponding databases at the Lowell GIRO Data Center (LGDC). During this initial phase of the project, all data are processed in real-time for the calculation of the angles-of-arrival and Doppler frequencies of ionospherically reflected high-frequency (HF) radio signals. A new database, TIDBase has been set up at LGDC for the ingestion of the new type of skymap data files, “DOP”, containing the D2D skymap data. TIDBase also stores the results of the FAS analysis providing information on the reference time, the location of the TID, the observation metadata (location of instruments, operating frequency, expected maximum group path of 1E signal), extracted time series of the RF signal characteristics, the derived TID characteristics, and the uncertainty/quality flags.
Visualization of the TID amplitude, velocity, wave period, and propagation direction at all reflection points in the network provides a near real-time comprehensive picture of TID activity over Europe. The NET-TIDE identification and warning service, provides the user with an overview of the evolution of perturbation within the last 3 hours displaying the time plots of group path, Doppler frequency, and arrival angles. The TID wave amplitudes measured at different links and frequencies will of course be different and therefore appropriate reference levels are needed to facilitate the assessment of the importance of the perturbation from the user side.
In this deliverable, we describe the methodology implemented to develop the warning system, its functionality and several cases when TID are detected. The system is under development, comments are collected from the users and stakeholders and the final release will be available in November 2017.
2. Net-TIDE warning system methodology
All measured D2D ionogram and skymap data are ingested in real time via Internet in databases at the Lowell GIRO Data Center (LGDC), http://giro.uml.edu/. The D2D skymap data and the FAS analysis results are archived in a new database, TIDBase. During this initial phase of the project, all signal processing of the measured skymap data and the FAS analysis have been performed at LGDC. To enable retrospective analysis of past data TIDBase also stores complimentary information on the reference time, the location of the TIDs (mid-point of the D2D links), the observation metadata like the coordinates of the link endpoints, operating frequency, etc.), and the extracted time series of the RF signal characteristics {ρ, δ, ε, β}. The derived TID characteristics AN, TΩ, Vp, and Θ for the dominant (maximum amplitude) TID wave component are also deposited in TIDBase. The TID characteristics and all required metadata and data from the D2D soundings are harvested by the NOA client service every 5 minutes. For TID alert applications real time Net-TIDE FAS results are displayed in graphical form at http://tid.space.noa.gr; the display is refreshed every 5 min. The chain of operations is displayed in Figure 1.
3. Net-TIDE warning system functionality
The Net-TIDE warning system provides in real-time results from the retrieval of the D2D observations “OBLIQUE mode” and the plots of the MUF parameter observed within the last 12 hours from the five Digisondes participating in the Net-TIDE pilot network “VERTICAL mode”. The visualization tool is openly accessible at http://tid.space.noa.gr.
3.1. Oblique mode
Clicking at the “OBLIQUE” button, the user can get the TID characteristics extracted from oblique D2D operations. The Net-TIDE DPS4Ds operate in oblique drift mode (D2D) in bi-static link with another station of this network (Receiver-Transmitter pair), performing oblique drift soundings of 20 sec duration once every 5 minutes. The collected data files have a DOP format. From their analysis, the TID explorer software calculates the characteristics of the TID wave. Based on these characteristics, the warning system indicates with an arrow the occurrence of the TID observed at the reflection point between the Transmitting and Receiving station. This representation is refreshed every 5 minutes.
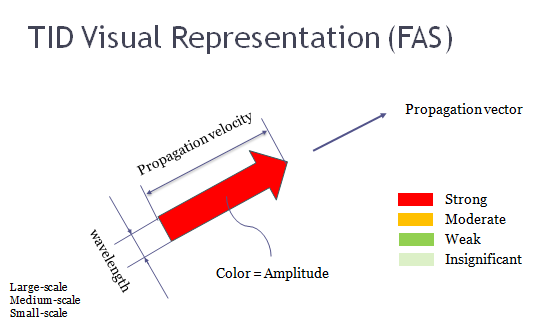
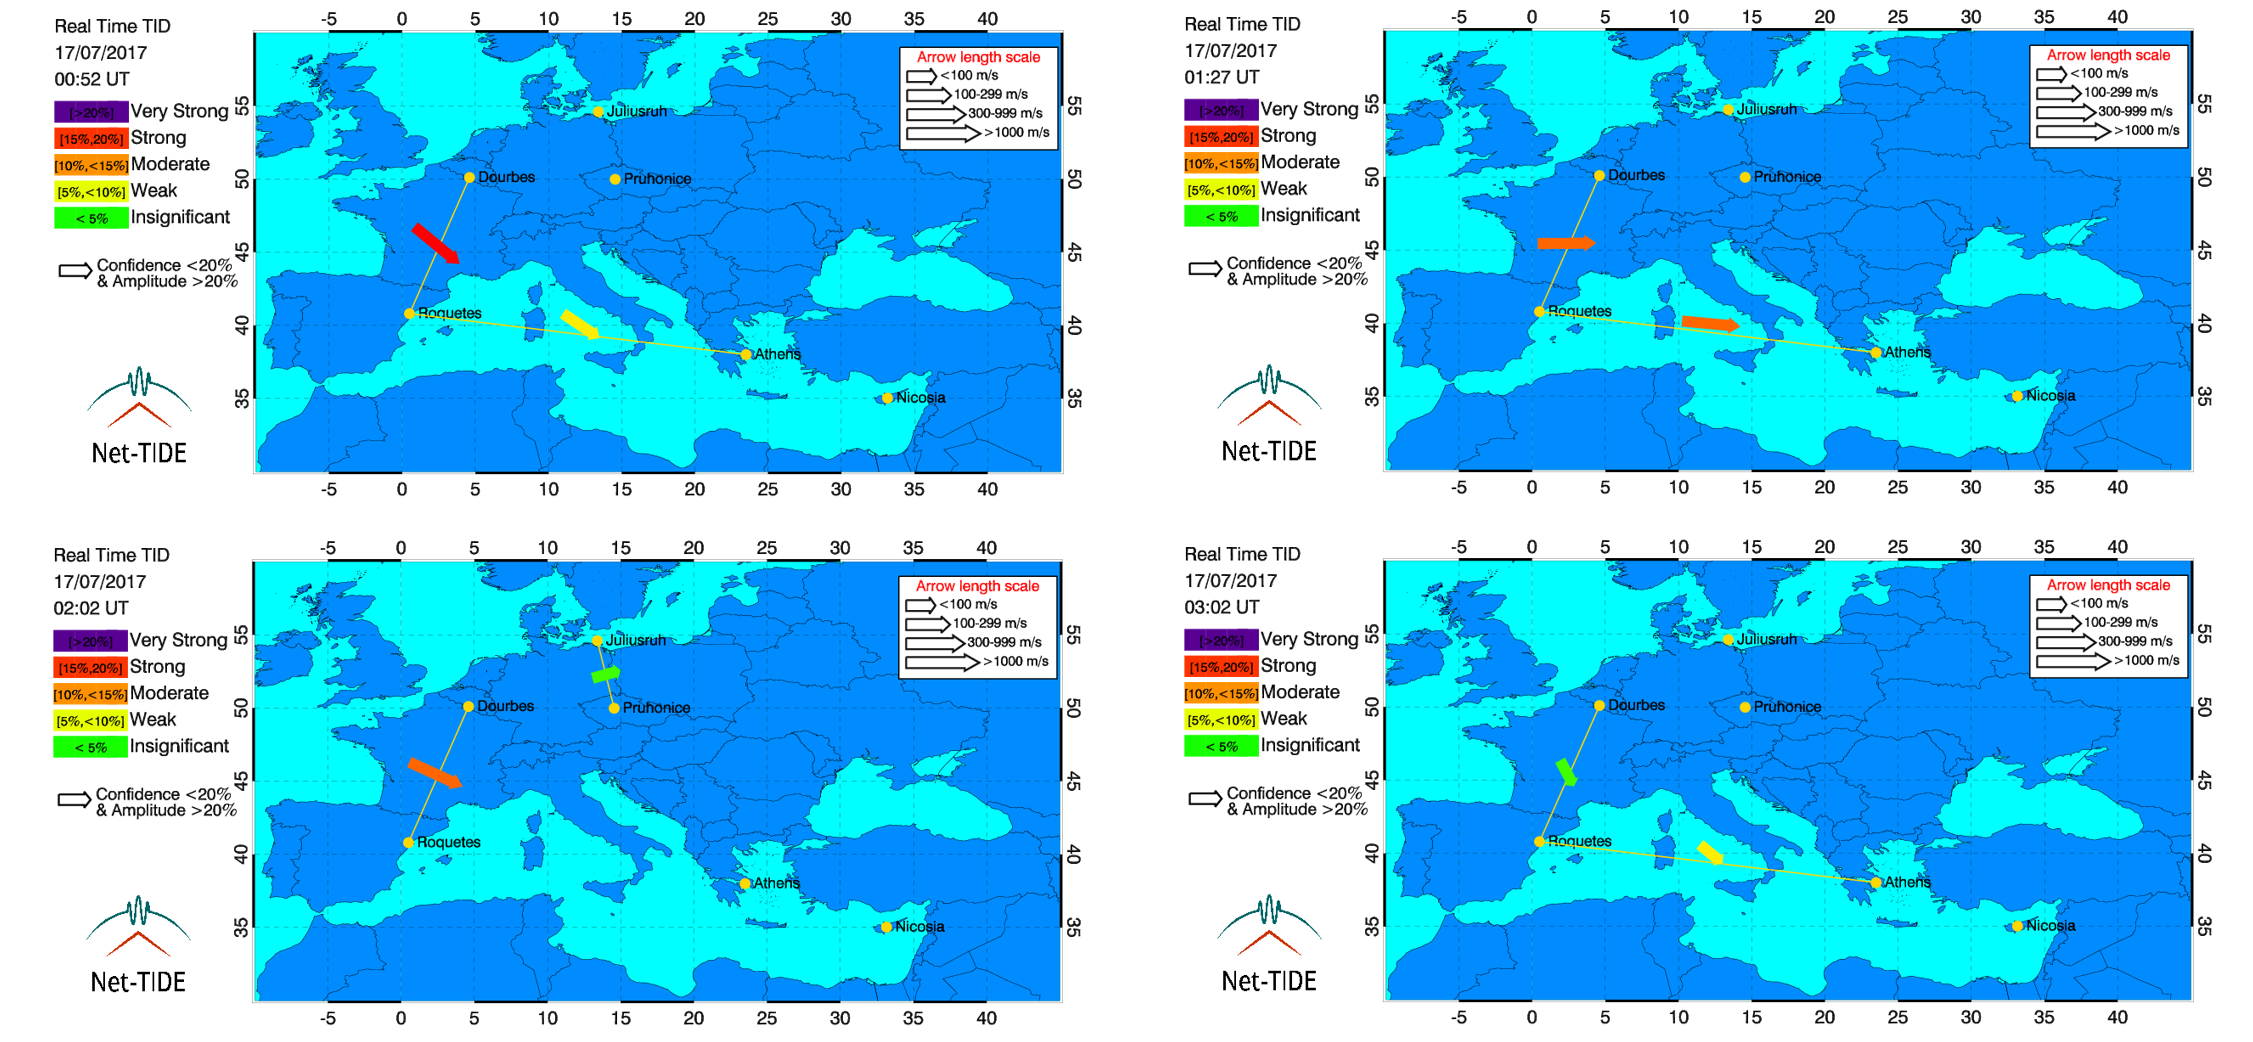
As shown in Figure 2, the color of the arrow is indicative of the amplitude of the detected perturbation in respect to the ambient electron density, the length of the arrow is indicative of the propagation velocity and the inclination is indicative of the azimuth.
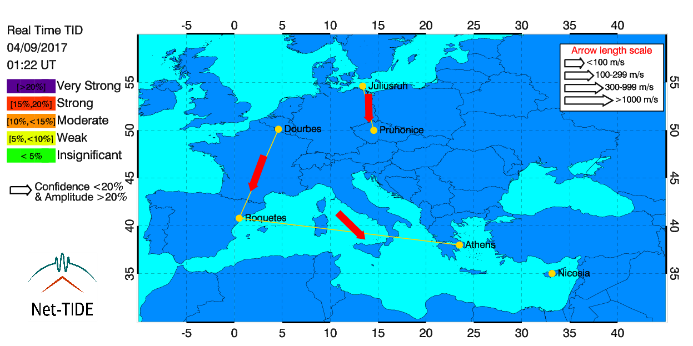
A quick view of the TID activity over Europe is possible from a simple inspection of the map with the TID arrows, as shown in Figure 3.
For a more detailed information, the user can click on each arrow to get in the right hand side the list of corresponding TID parameters together with the evolution of perturbation within the last 3 hours, in the form of time plots of the group path, Doppler shift, zenith and azimuth angles. This representation is shown in Figure 4.
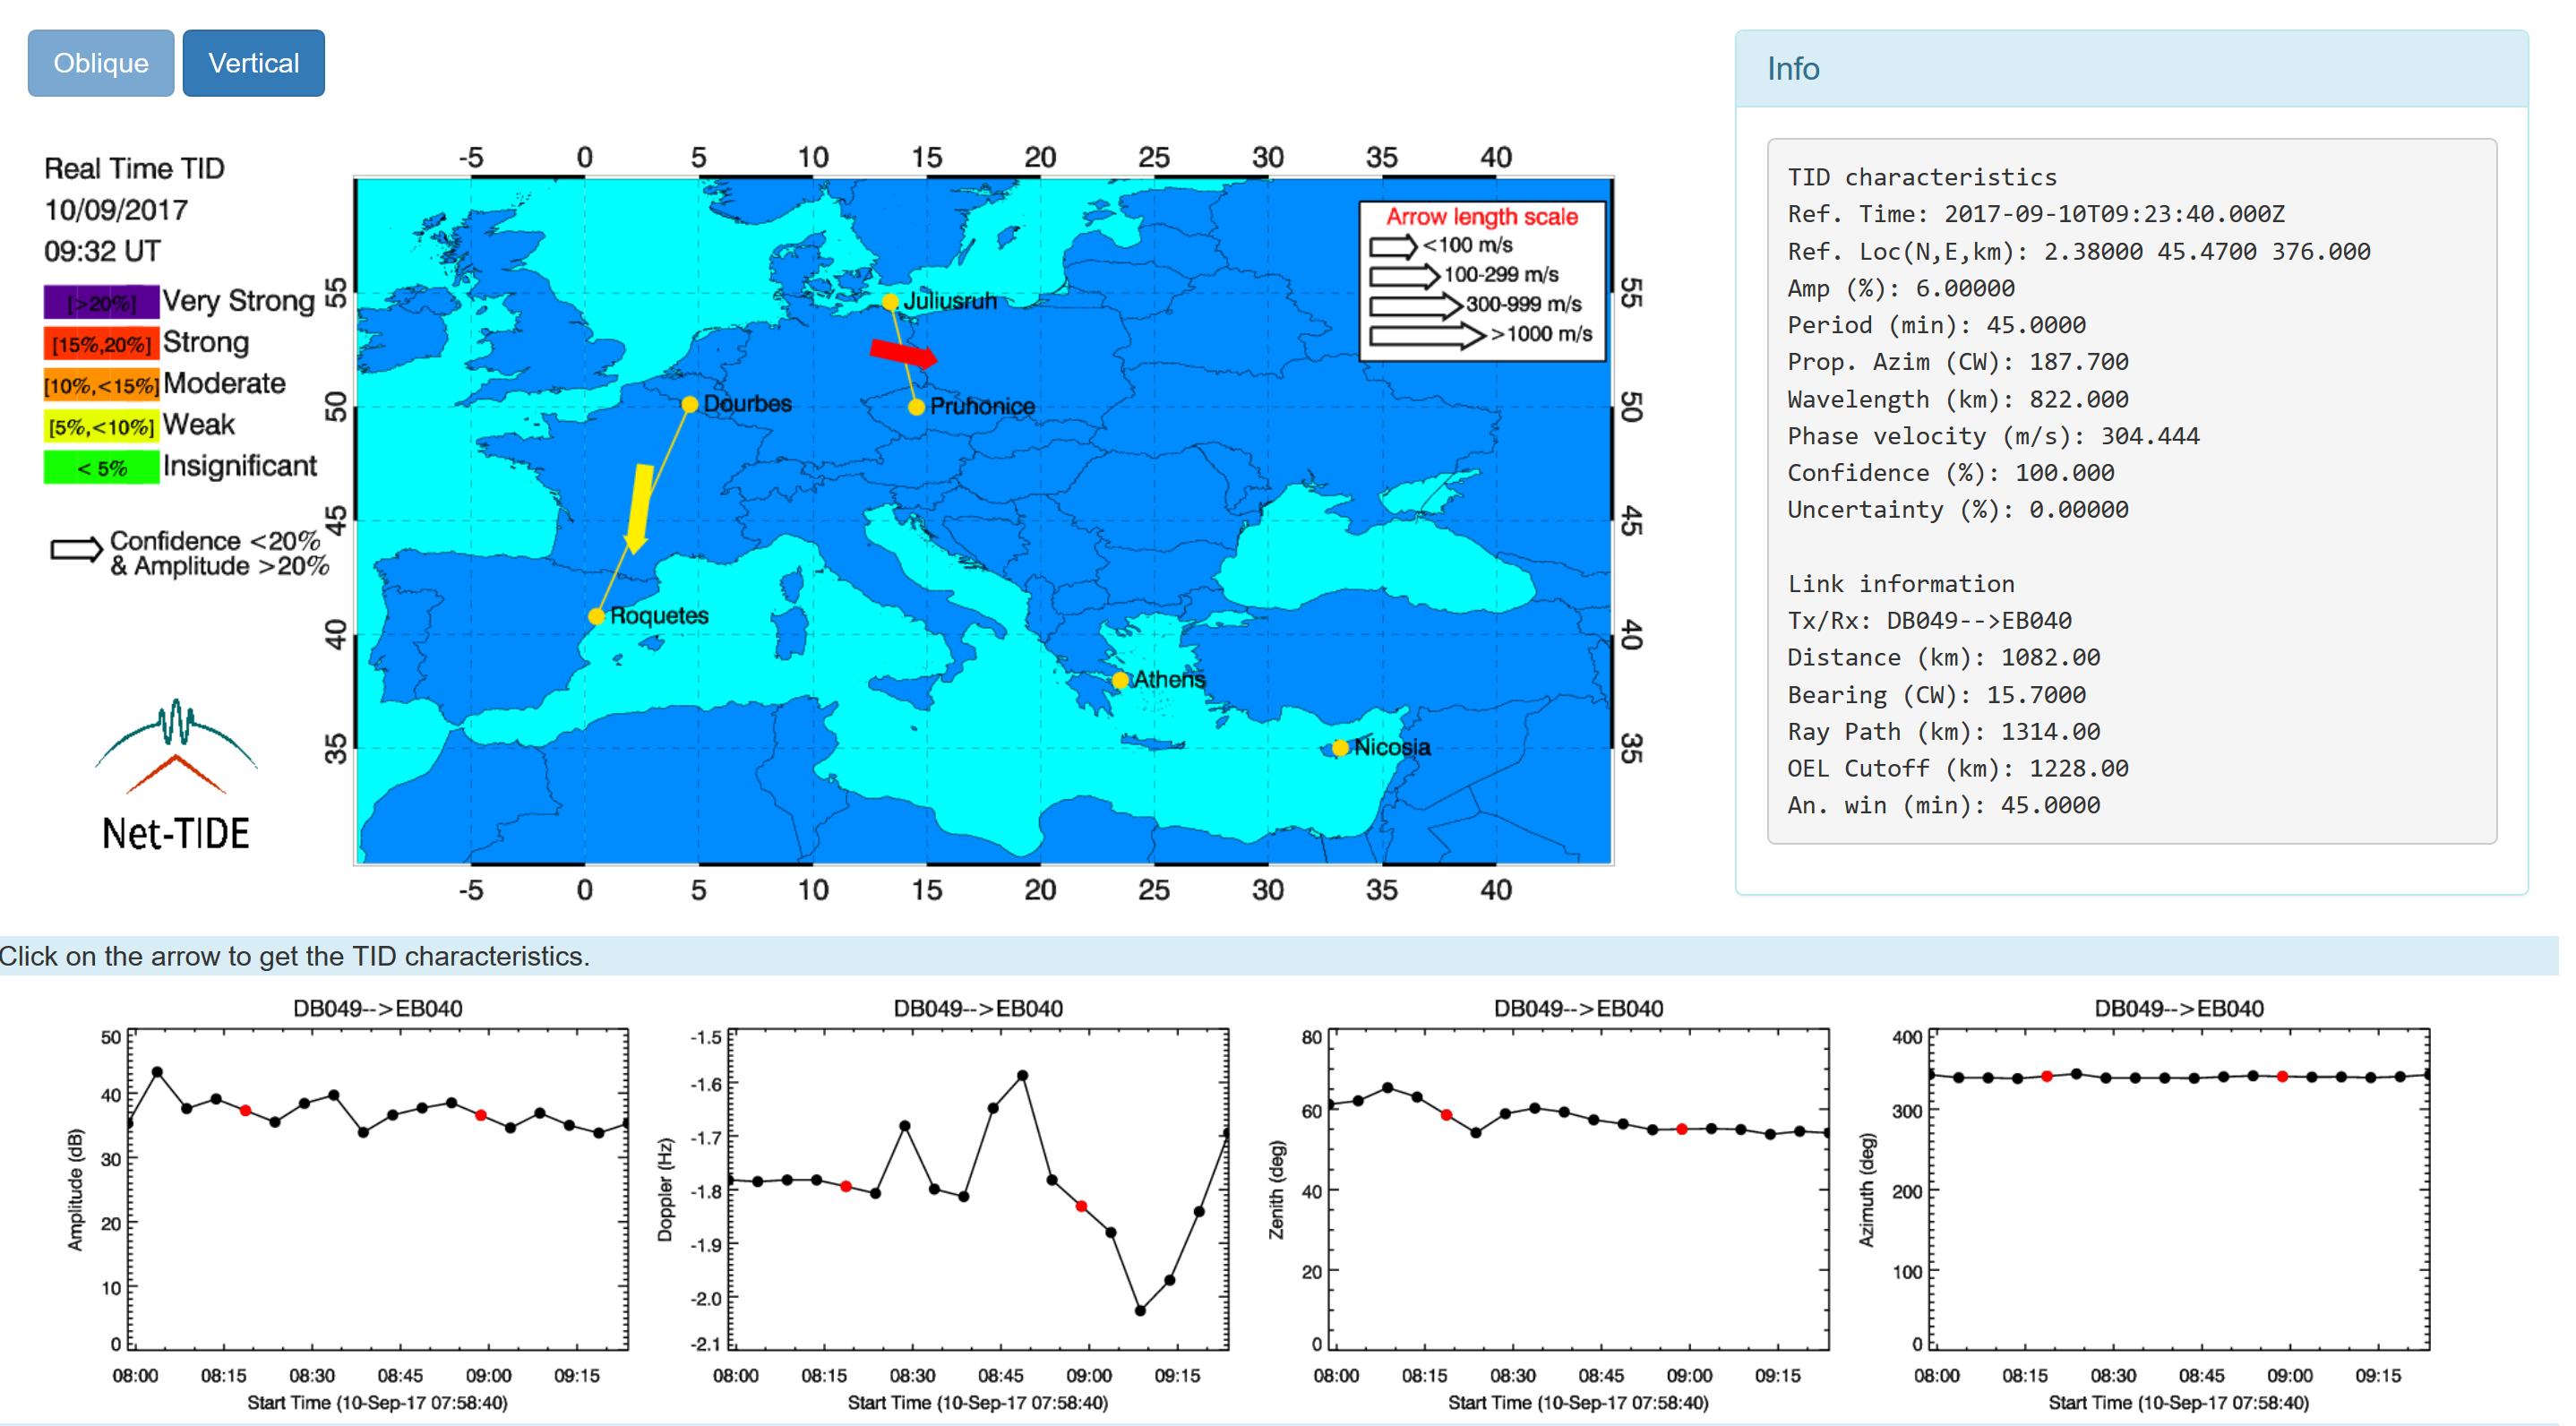
In the plots of the TID characteristics, the red dots correspond to interpolated measurements. Interpolation is applied only when up to 2 consecutive observations are missing.
3.2. Vertical mode
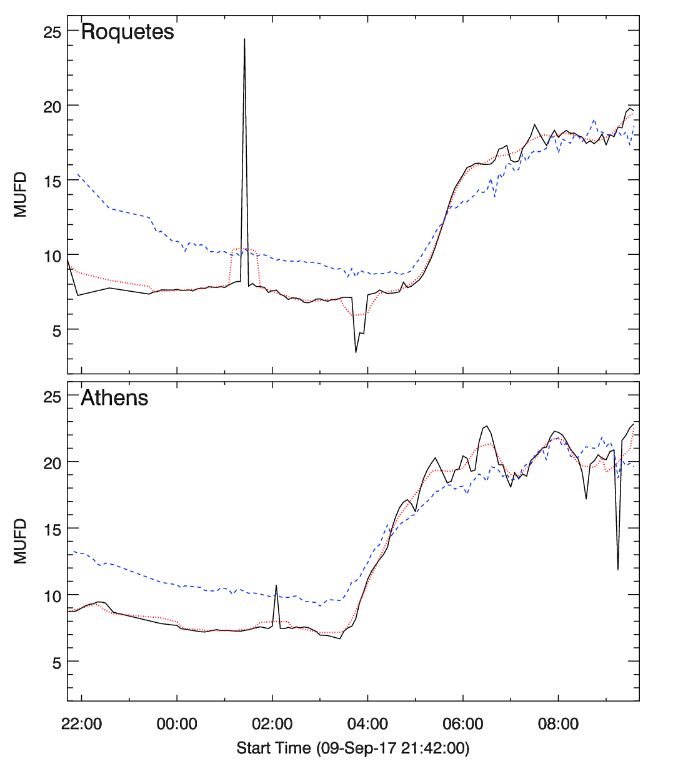
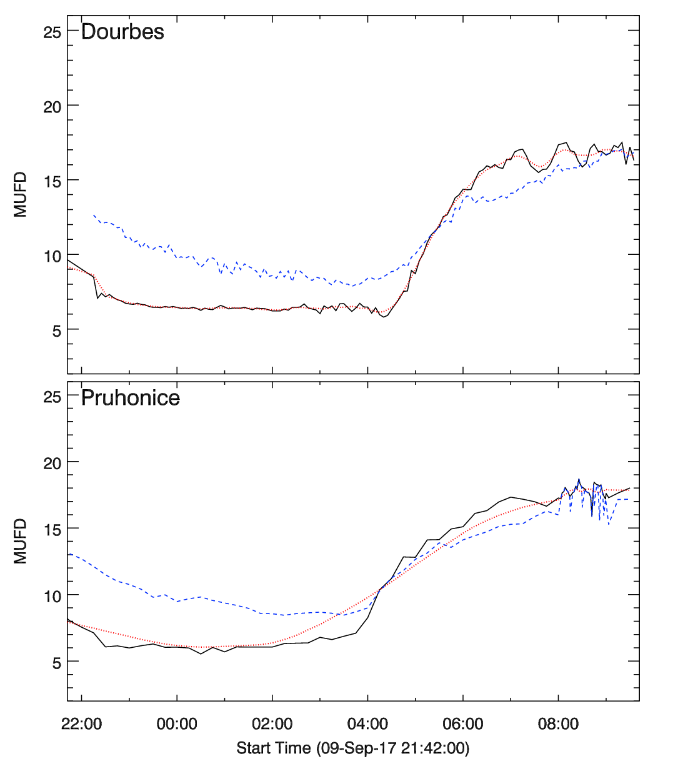
Clicking at the VERTICAL button, the user can get the time plots of the Maximum Usable Frequency (MUF). The MUF is the highest radio frequency that can be used for transmission between two points via reflection from the ionosphere at a specified time, independent of transmitter power. It’s variability in respect to the expected MUF values, is indicative of the perturbations observed in the ionosphere at a given time. Here, we present the observed MUF parameters at each Digisonde location for the last 12 hours. Plots from one north-south chain (Juliusruh – Pruhonice – Athens) and two east-west chains (Dourbes – Pruhonice, Roquetes – Athens) are updated in real-time. In addition to the actual observed parameters that are marked with black solid line, two more quantities are given: the running median value based on the past 30 days of observations (blue dashed line), and the 2 hours running average (red dotted line). The de-trending function (in this case the running average) fits the actual measurement at the same given time, and therefore the deviations obtained by de-trending curves are thought to represent the short-term oscillations. On the contrary, the relative deviations of MUF from medians show variability due to large scale ionospheric disturbances.
Figure 5 presents a screenshot of the Net-TIDE warning system under the option “VERTICAL”. An enlarged view can be obtained when clicking on each plot as shown in Figure 6.
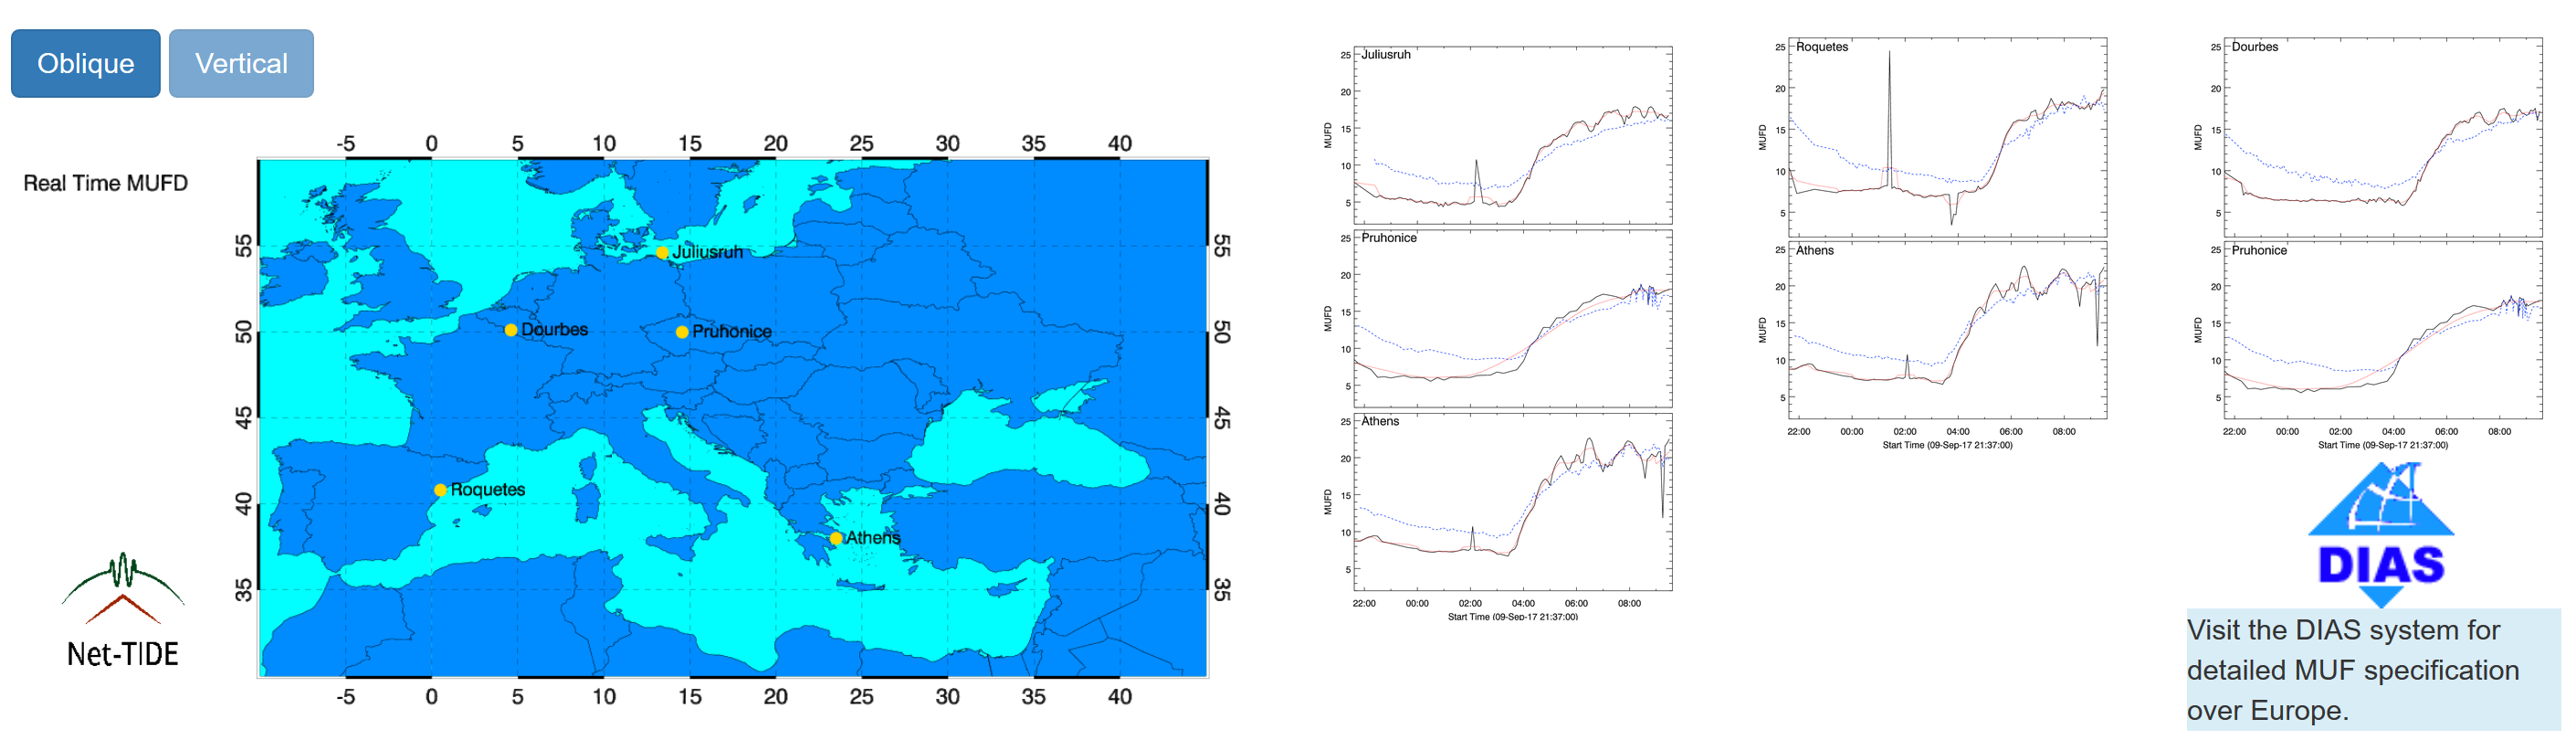
It is important to note that the MUF characteristics plotted here are the result of the automatic scaling. This can result to important offsets; therefore this information must be handled with caution.
For better elaborated MUF information, the user is encouraged to visit the European maps of MUF provided by the DIAS system at http://dias.space.noa.gr.
3.3. Supporting information
At the bottom of each web page in the Net-TIDE warning system, the user can get:
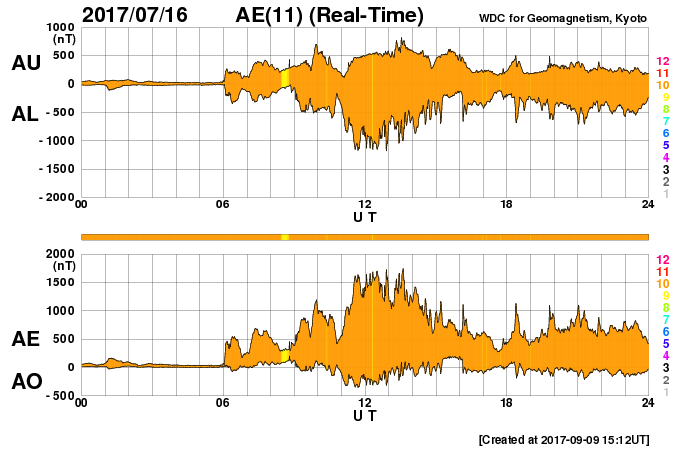
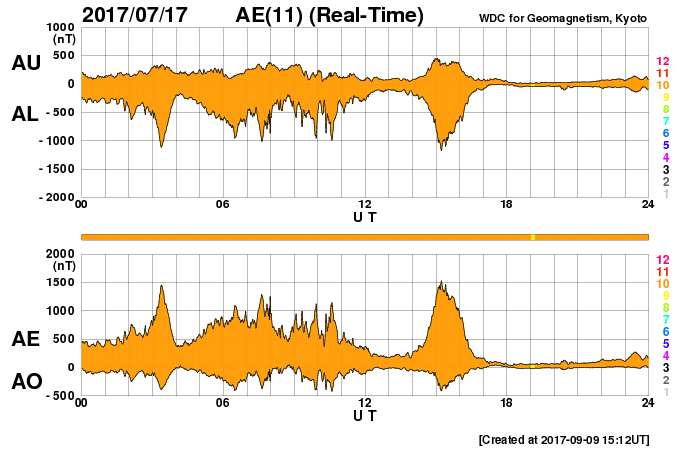
The current plot of the AE indices, updated in real-time. The AE indices are representative of the intensity of the auroral electrojets, and therefore it can be considered as a proxy for the Large Scale Travelling Ionospheric Disturbances.
The Geophysical Alert released by the US Department of Commerce, NOAA, Space Weather Prediction Center. This short text provides information for the current space weather conditions and it is updated in real-time.
4. Demonstration of the Net-TIDE warning system performance
4.1. Substorm occurred on 16-17 July 2017
4.1. Substorm occurred on 16-17 July 2017
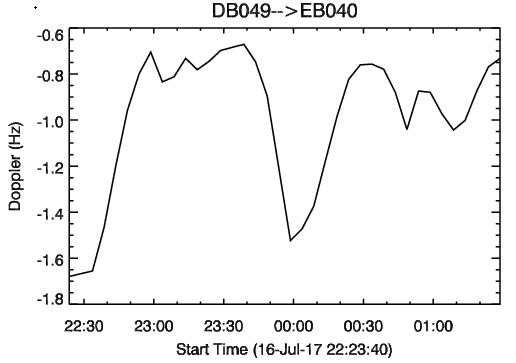
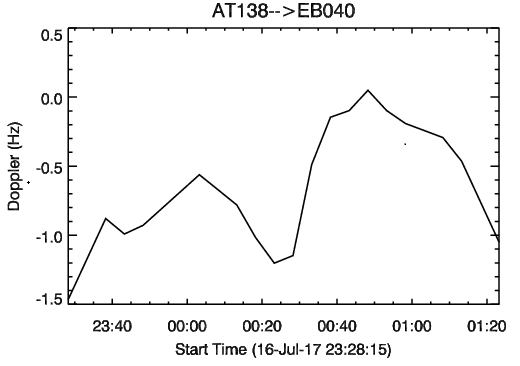
The substorm activity occurred on 16 July 2017 triggered TID propagated south-east. The activity is detected in the three active links of the Net-TIDE network, Athens-Ebro, Dourbes-Ebro, Pruhonice-Juliuruh.
A noticeable Doppler shift is calculated in the links between Dourbes-Ebro and Athens-Ebro (Figure 8).
4.2. Substorm occurred on 4 September 2017
Within the first hours of the 4th September 2017 an isolated substorm occurred as recorded by the AE indices. From 00.07 UT to 01.37 UT the resulting TID activity is detected by the Net-TIDE warning system (Figure 9).
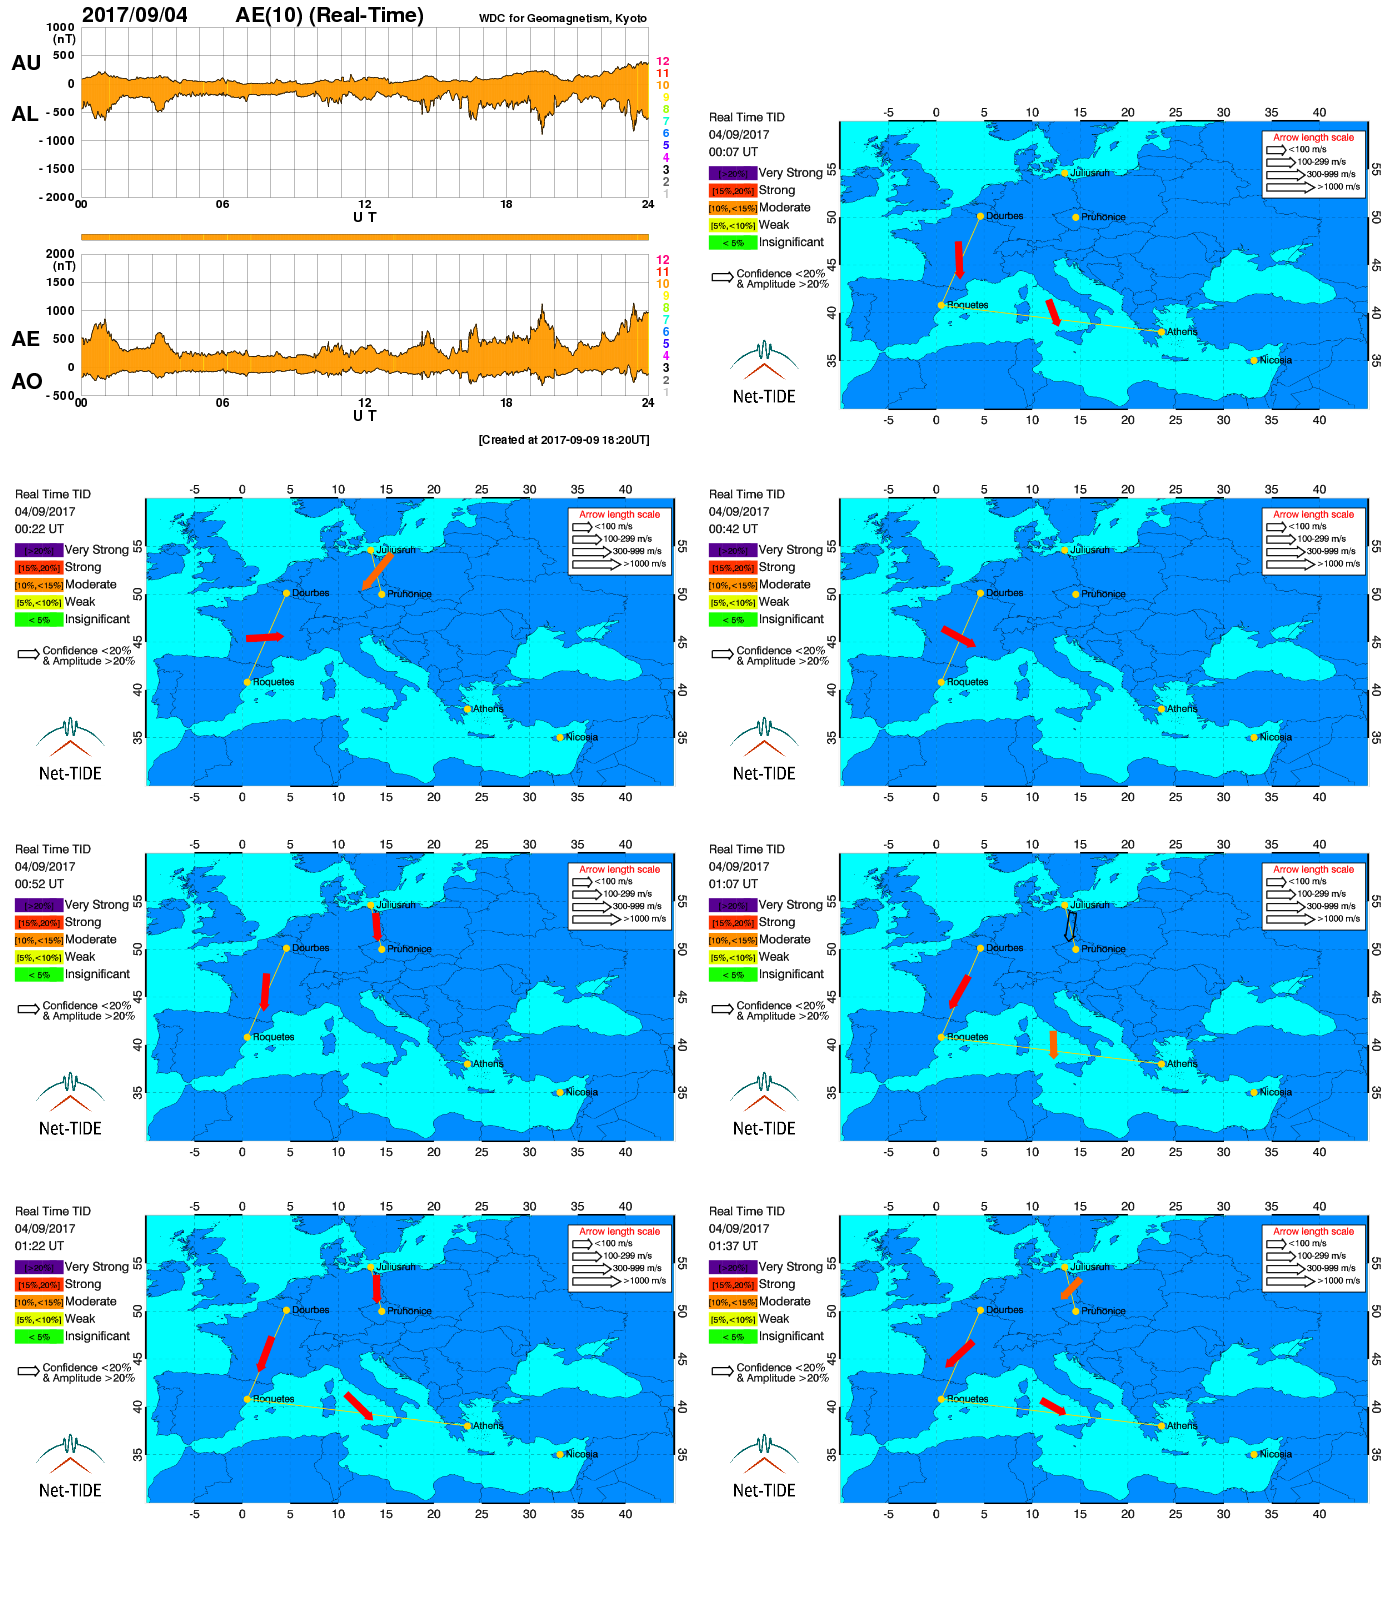
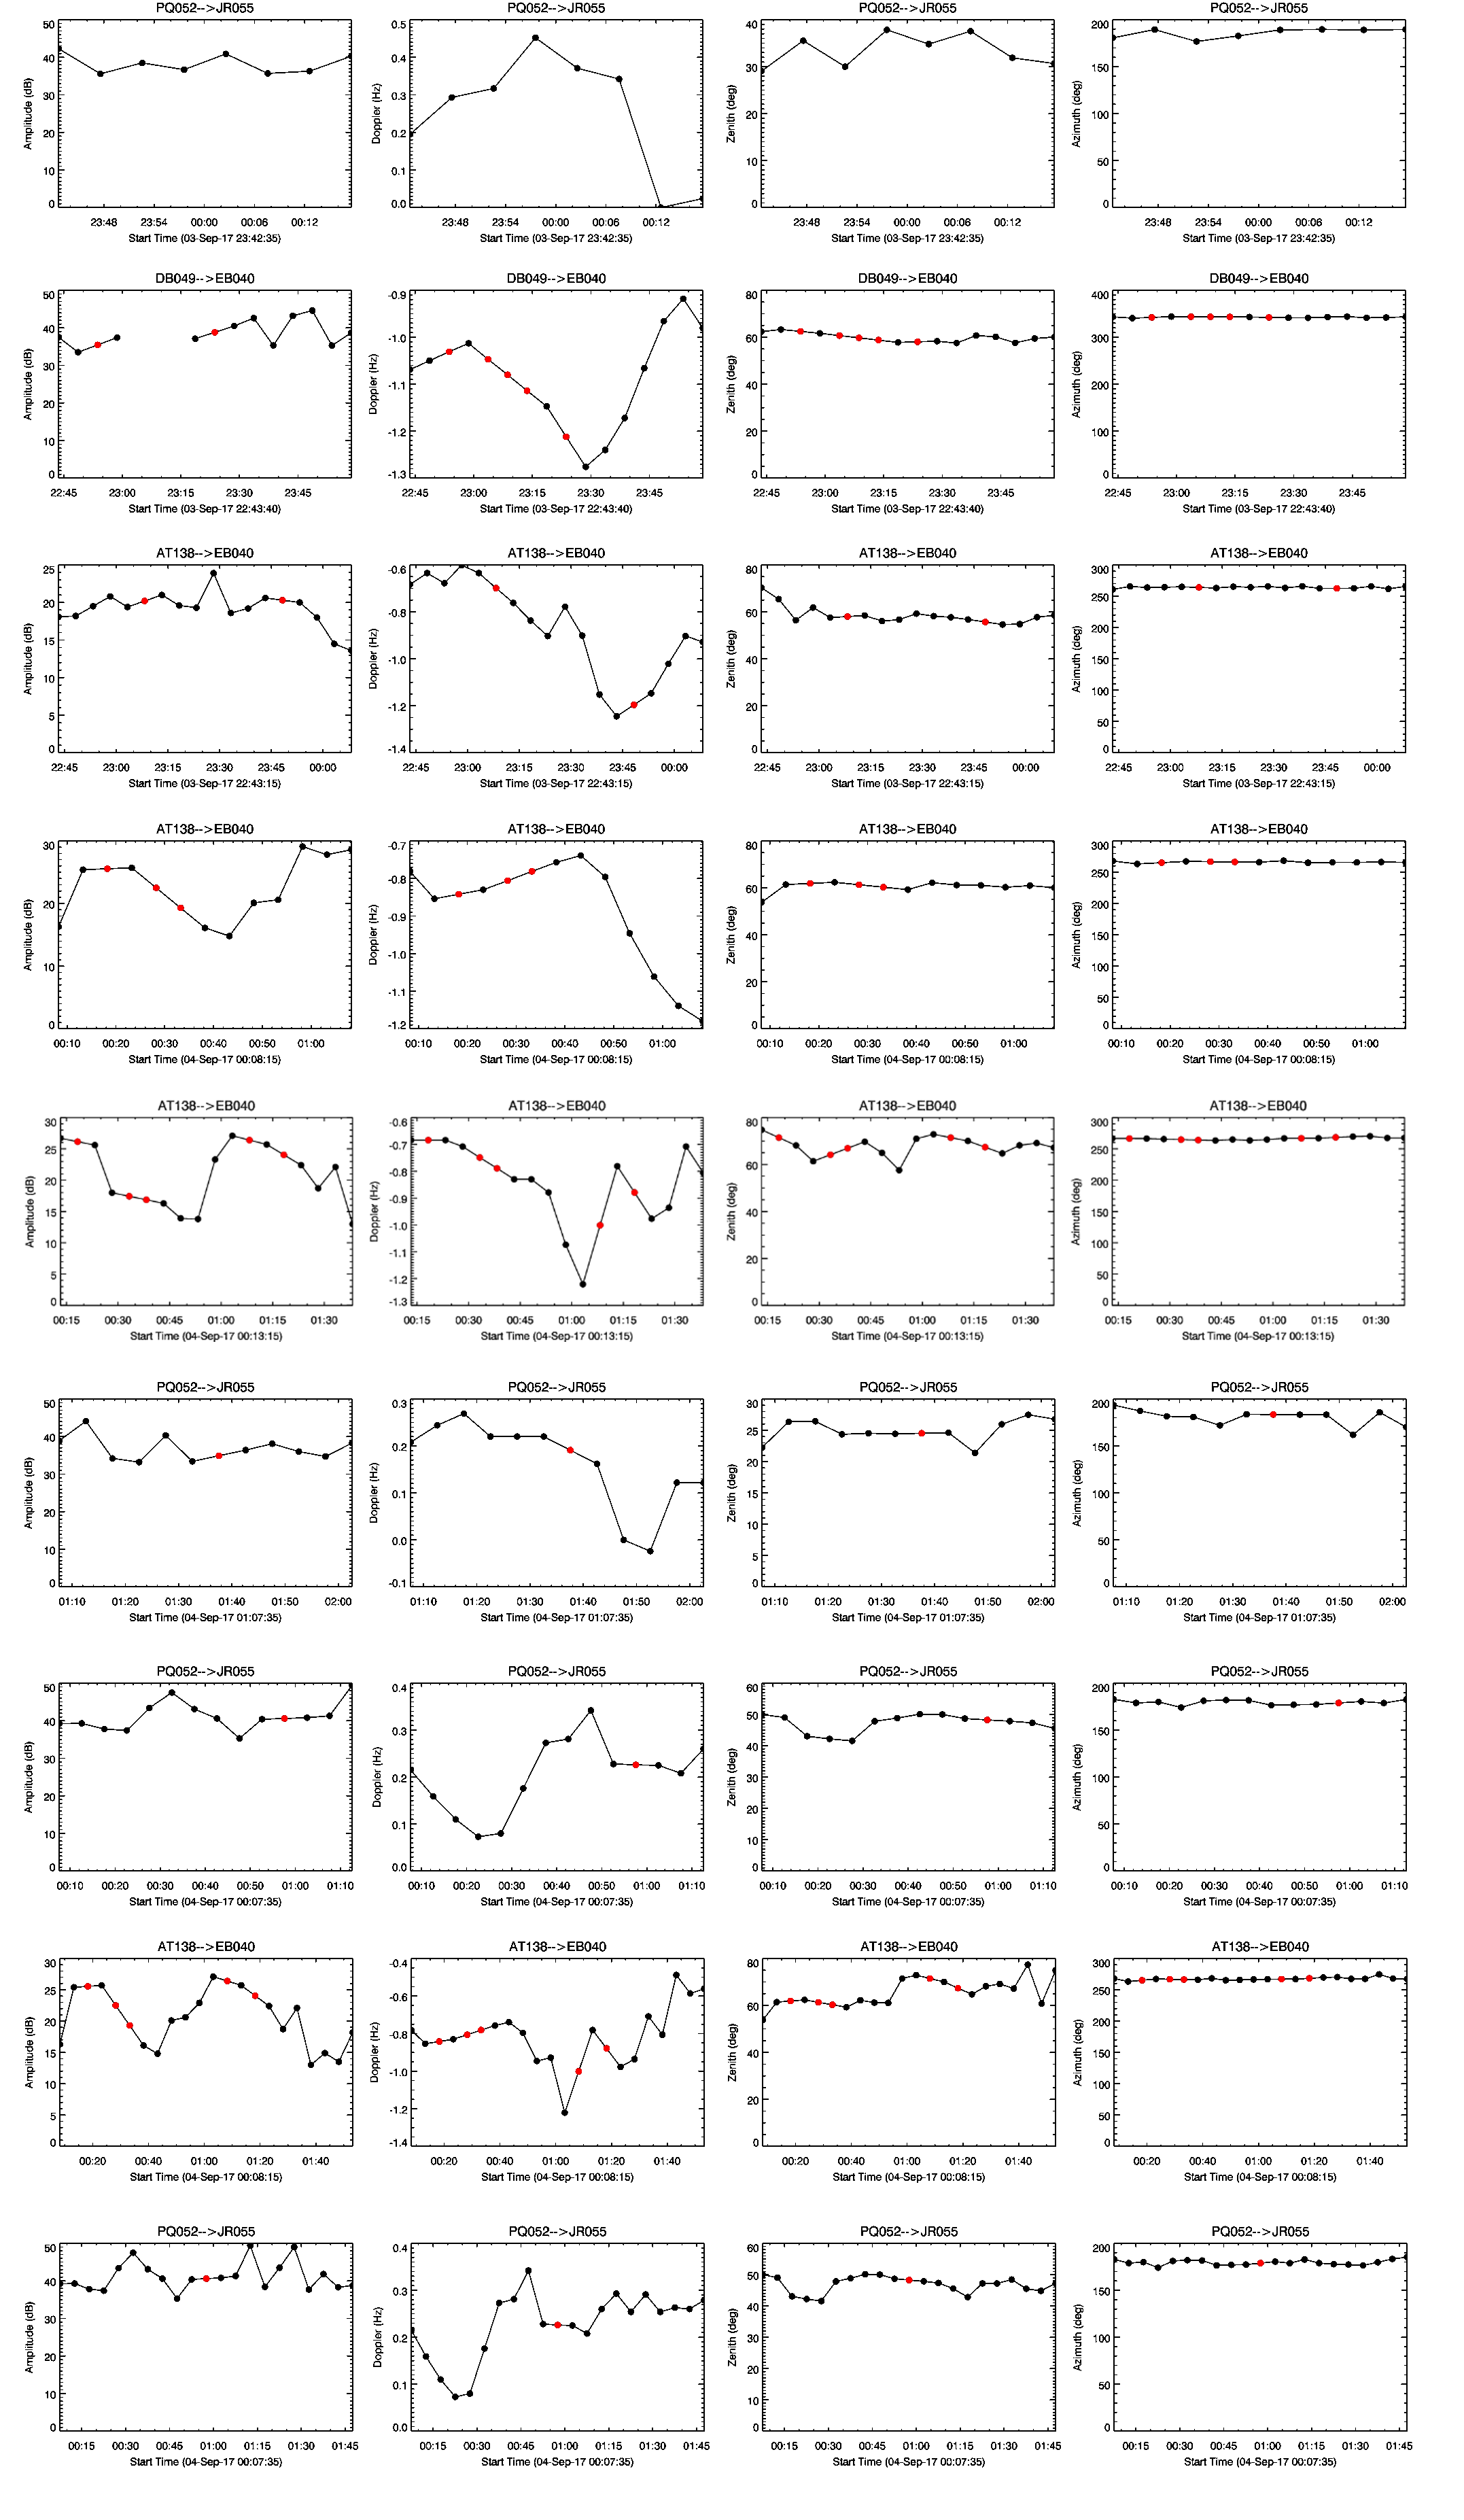
During this TID active interval, a noticeable disturbance is seen in the Doppler shift, calculated with the D2D data collected from the three active links, while the propagation direction is south-east (Figure 10).
4.3. Detection of MS-TIDs
During quiet auroral conditions on 3 May 2017, the Net-TIDE warning system detected a weak TID activity in the two active links propagated from south to north (Figure 11).
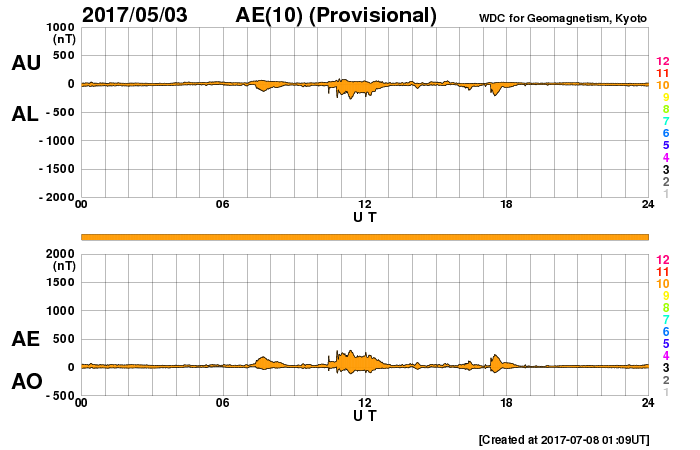
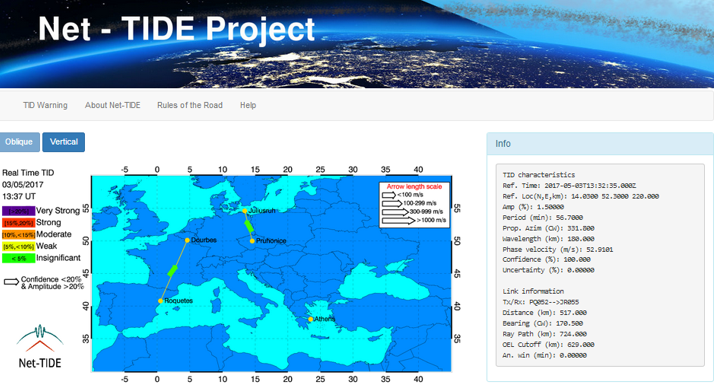
These are considered to be small scale TID detected with phase velocity ~55 m/s and amplitude 1.5% of the ambient ED.